Presentato alla prima conferenza su Saltwater intrusion and Coastal Aquifers-Monitoring, Modeling, and Management (Intrusione salina e monitoraggio, modellazione e gestione di acquiferi costieri). Tenuta a Essaouira (Marocco) nel 2001.
M. Hilali1, E. Lorrai2, A. Larabi1 and A. Giacomelli2
1 Mohammadia School of Engineers,
Rabat
Morocco
2 Centre for Advanced Study, Research and Development in Sardinia (CRS4)
Cagliari,
Italy
In the Moroccan Sahel
water resources for agricultural, industrial and drinking use, are
obtained almost exclusively by groundwater supply. Due to a high
density of pumping wells, mainly located near the sea and
characterised by a consistent exploitation for agricultural use, the
Sahel aquifer system has been progressively affected by an increasing
saltwater encroachment. The stress induced in the aquifer by the high
pumping rates from the wells adds to a situation of natural saltwater
intrusion, determined by the high permeability of the coastal
aquifer, the thickness of the saturated zone and substratum.
The
study area, with a surface of approximately 3100 km2,
is part of a series of sub-atlantic plains in the coastal Méséta of
Morocco (Ferré 1975). The area is delimited to the North by the oued
(ephemeral stream) Oum Er Rbia, to the West by the Atlantic Ocean,
and to the South-East by the Abda et Doukkala region (Figure 1).
Agriculture represents the main economic activity in all the coastal
zone of the Sahel. The region is characterized by a maritime climate,
with an average annual rainfall of 350mm. Temperatures are relatively
moderate, varying between 12 and 25°C. Infiltration is estimated
around 7% on the yearly rainfall average; however we find this value
rising to or above 15% in some of the zones characterized by karst
structures (DRHT, 1994). Hydrologically, the Sahel may be classified
as an endoreic area, with no oueds
draining the internal part of the region and the limestone plateaus
of Safi and El Jadida.
A
geographic information system (GIS) provides functionality to store,
display and analyze data of different nature, and to integrate such
data for cartographic or modelling purposes. In order to provide an
enhanced characterization of the aquifer, it was decided to
organize the available set of data in a GIS framework. The data may
be summarized as:
-
Location and main characteristics of pumping and monitoring wells
-
Three-dimensional representation of the aquifer
-
Time series concerning variables such as piezometry, salinity, and
other chemical parameters;
-
Distribution of the hydraulic and hydro-chemical parameters;
-
Description of different conditions of aquifer recharge and
depletion;
-
Representation of different hydraulic structures (or activities)
directly or indirectly related to the aquifer system, such as
xxperimètres irrigués.
These data, originally deriving from different
sources and provided on different media, have been processed and
organized in a common directory-based repository. The access to the
different sets of information, represented by a group of geographic
layers and a database for the storage of all alphanumeric data, has
been based on the ArcView package, with the construction of a set of
“projects” (i.e. user interfaces) reflecting the logical
organization of the data by grouping the geographic layers and
relating to each of these the relevant alphanumeric information.
Namely, the main layers include monitoring and exploitation wells,
geology, elevation, transmissivity. Salinity and piezometry maps for
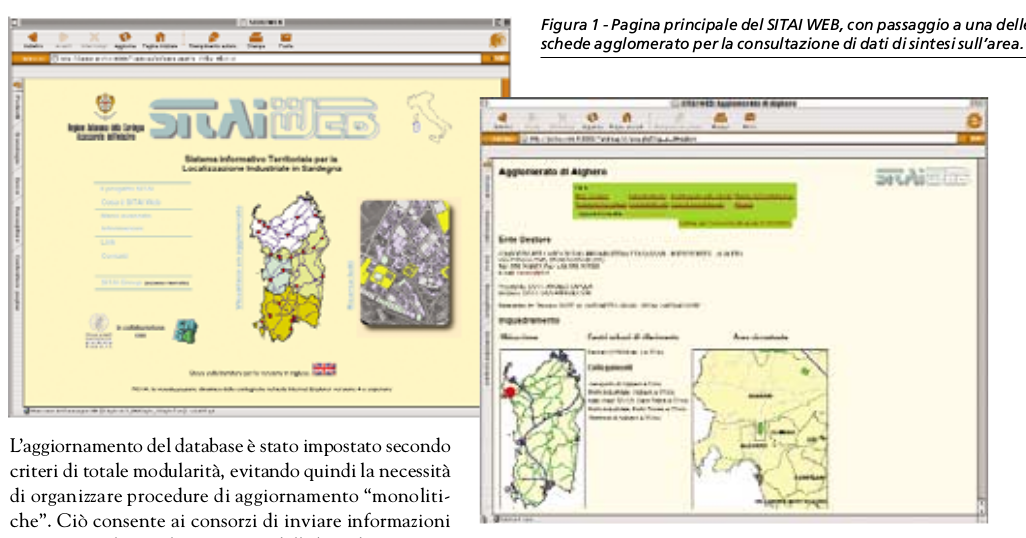
different time periods have also been derived. Figure
2 provides a sample display from one of the ArcView projects created,
showing the distribution of the monitoring wells and of the
exploitation wells which have been recorded during a recent survey on
the coastal part of the Sahel.
Following the setup of the database and the characterization of the
aquifer system obtained by the analysis of the geographic data and
the available time series, the database will be used to support a set
of hydrologic simulations based on the CODESA-3D model, thus
complementing other studies undertaken within the same project both
in the Sahel area and in other sites in the Mediterranean area
(Paniconi, 2000).
References
DRHT, Elaboration d’un
schéma d’exploitation des eaux souterraines du Sahel. Rapport de
synthèse. F.A.O Projet TCP/MOR/2251. Marrakech (Maroc), 1994.
Ferré M., Ruhard J. P., Les
bassins des Abda-Doukkala et du Sahel de Azemmour à Safi. – Ress.
En eau du Maroc. Tome 2. Ed. Serv. Géol. du Maroc. Rabat. pp.
261-298, 1975.
Paniconi, C., Report on the
Preliminary Study of Soil and Aquifer Degradation from Seawater
Intrusion in the Coastal Areas of Tunisia, Morocco, and Sardinia
(R.A.S. L.R. 19/96, Phase II), Centre for Research, Development, and
Advanced Studies in Sardinia (CRS4) and Ente Autonomo del Flumendosa
(EAF), Cagliari, Italy, November 2000
Acknowledgements:
The study was financed by the Sardinian Regional Authorities (L.R.
19/96, International cooperation for development).