Here they are (info@pibinko.org)

Here they are (info@pibinko.org)

Speaking to people about what we do, something we go for metaphors, sometimes for equations, sometimes for songs, or sometimes we just close our eyes and feel the breeze.
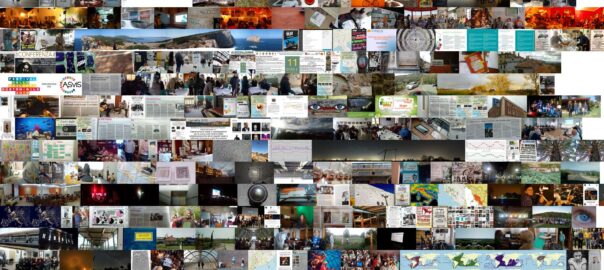
To provide yet another expression for the concept of “interdisciplinary protection and promotion of lesser known assets in the fields of culture, environment, and open innovation” I wrote a few lines of code displaying all of the photos published on this WordPress site in a row. This generates a sort of mosaic.
The result is a log which is partly in chronological order (for each event we do we have at least one photo on the site), and partly not, since we are also gradually importing to the site photos of things we did in pre-blog times (since 2000), which in the system are assigned the data of when the file is uploaded. In any case the effect is interesting, and some of you may recognise situations and folks.
To see the whole “movie” try: http://www.pibinko.org/scripts/listallimg.php . This will get you almost 1000 images (as of July 10, 2019), and will require some time to load, although the final effect is neat. Otherwise, you can try the month-by-month option:
January – February – March– April– May – June –
July – August – September – October – November – December
If some of the shots capture your curiosity, you can try and find the corresponding news on the blog, of write for more information.
The core of the images starts in 2015.
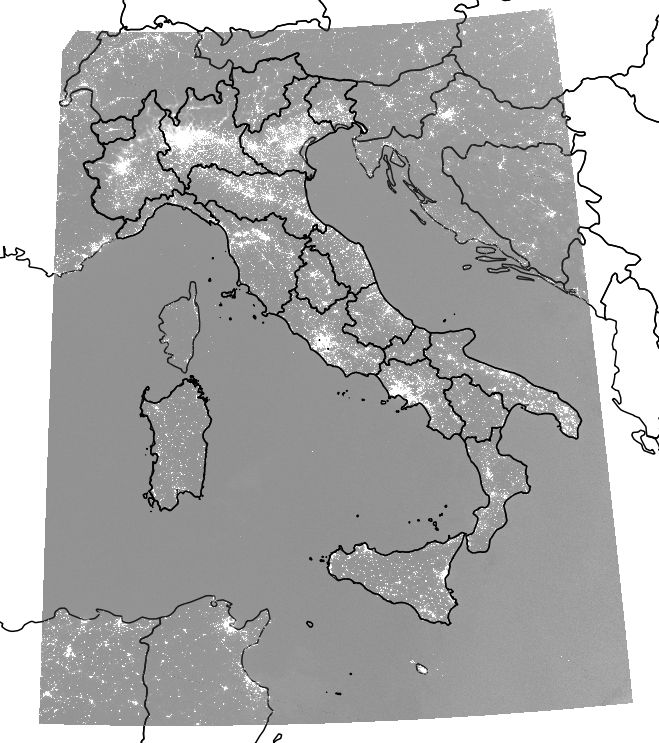
In the May 16 conference which we organised in Brescia with the BuioMetria Partecipativa project in collaboration with the University’s DICATAM on Interdisciplinary promotion and protection of the night sky, we had a very interesting talk on Italian Regional legislation by Maria d’Amore. Maria has been following this topic for over ten years working at the Emilia-Romagna regional administration, and among other topics she presented a table which we then invited her to share.
The table shows similarities and differences, with respect to various criteria, region by region (for those regions where light pollution regulations are present). This table is an extremely interesting reference both for experts, and for non-experts who may have an idea of how different administrations have been approaching the same topic in the course of time.Regions are listed according to a reverse chronological order related to the year of publication of the most recent law.
The table is updated to June 2019 and is currently maintained in Italian (we may consider translating the table if there are specific requests). For comments or for more information, please write to: bmp@pibinko.org
As a background this calls for the “Southern Cross” by Crosby, Stills e Nash
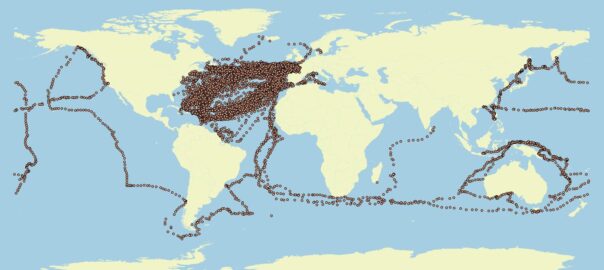
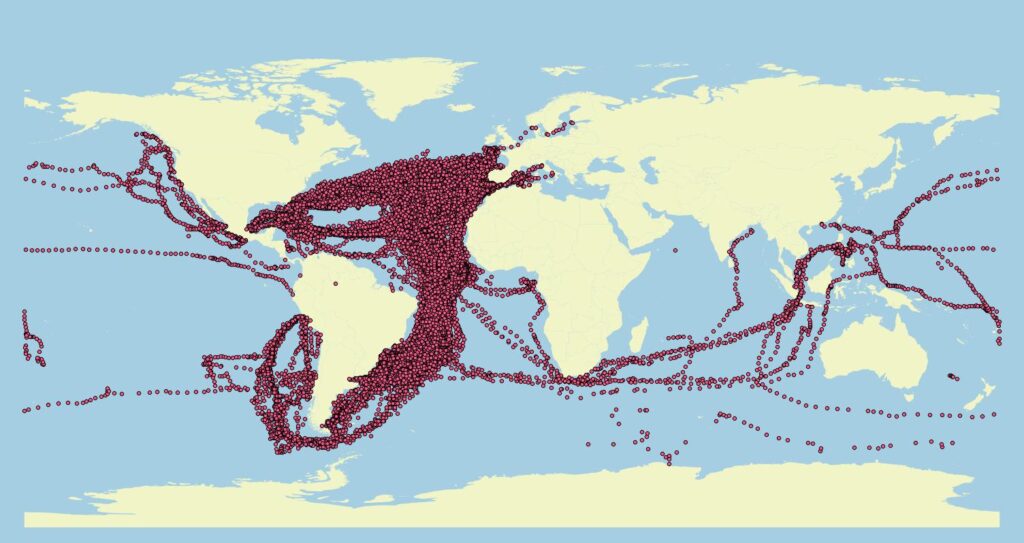
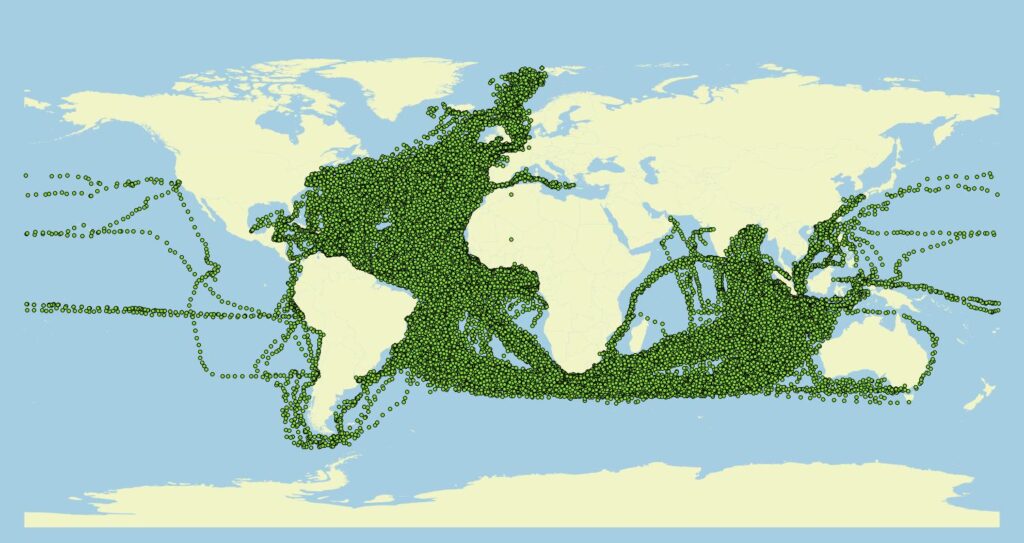
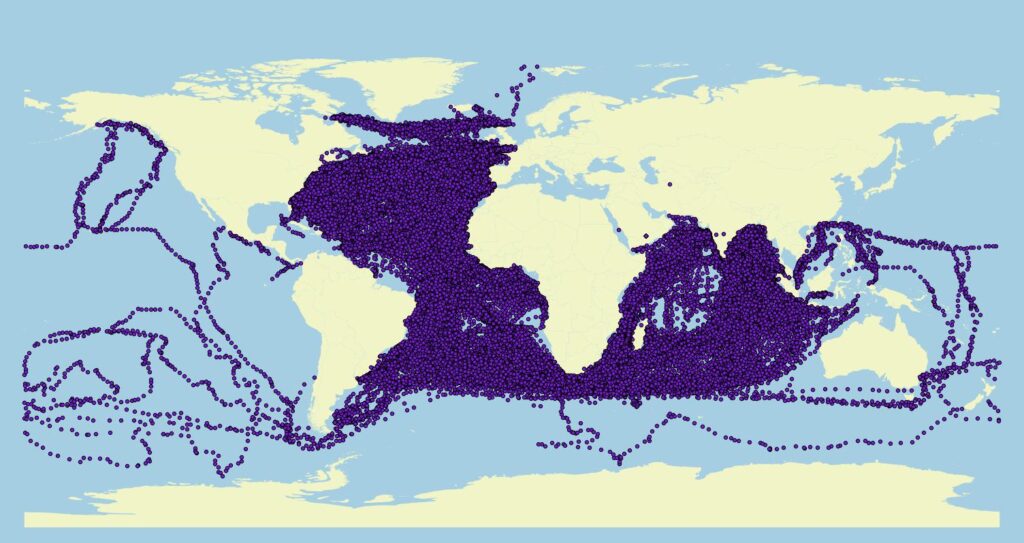
On the line of promoting lesser known resources in the field of culture, environment, and open innovation, I recently recovered the complete database of the CLIWOC (Climatological Database for the World’s Oceans 1750-1850) project. This was a European-funded project between 2000 and 2003 with the aim of digitizing the logs of ships from some European countries over a period of 100 years, so as to extreact weather observations, which needed to be recorded daily. Data are mostly from Spagna, Great Britain and Holland (with some data from France, Sweden, etc.).
Apart from the climatologic aspects, this exercise interested me because of the spatial analysis implications, and having finally accessed the full database, the annotations which can be found.
Here you see some basic visualizations (each dot is one day from a given ship, with additional data attached to it). Geopolitical analysts will be on the loose on this. During the Summer we will show you more of what’s in the CLIWOC trove.

With the pibinko.org network, since 2009 we have been preparing annual reports, which are normally published by January, covering the previous year.
We then issue periodic updates (as a minimum monthly, often weekly for our Italian audience). These include news, reports on events, and other ideas.
Exceptionally we need a mid-year status report. This happened in 2011, and 2019 looks definitely like another year where this can help. We also included some outlook through the rest of 2019.
The report comes in two pages, and you may download it from this link.
For those interested in previous episodes of the story, here you find our 2018 summary.. and the pibinko.org and jugbandcm.it sites have the full picture.
Inquiries and booking: info@pibinko.org
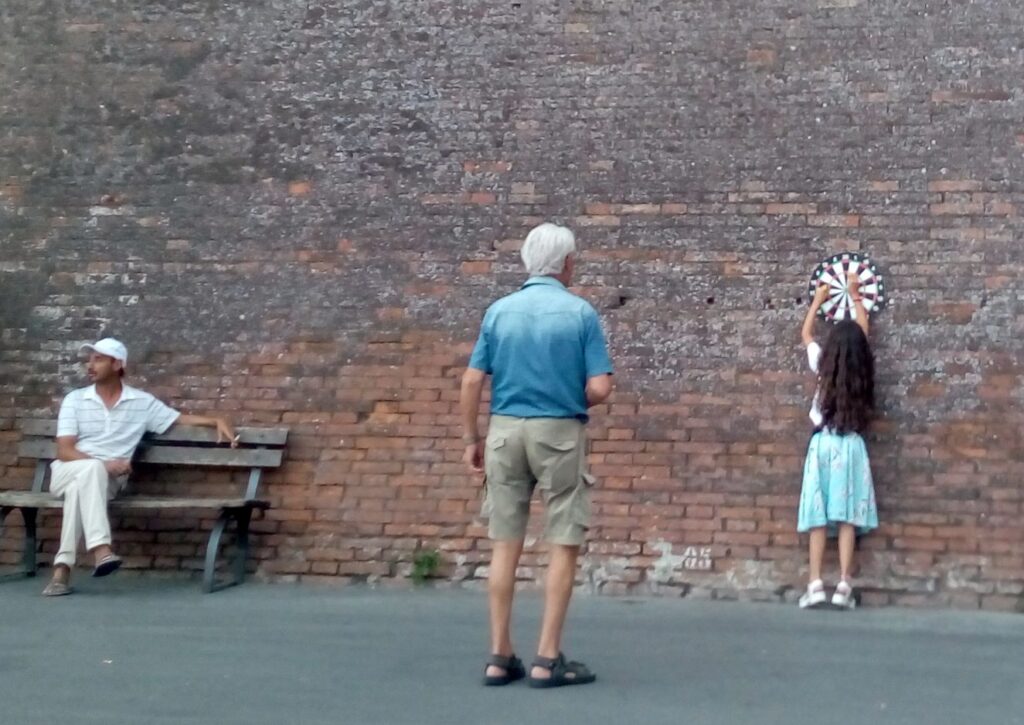
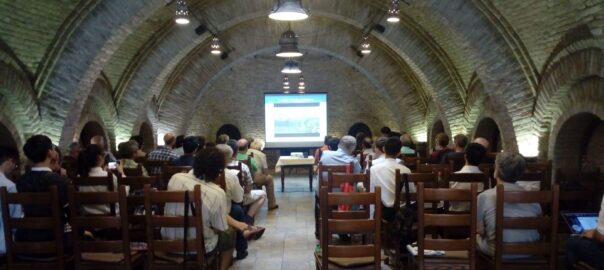
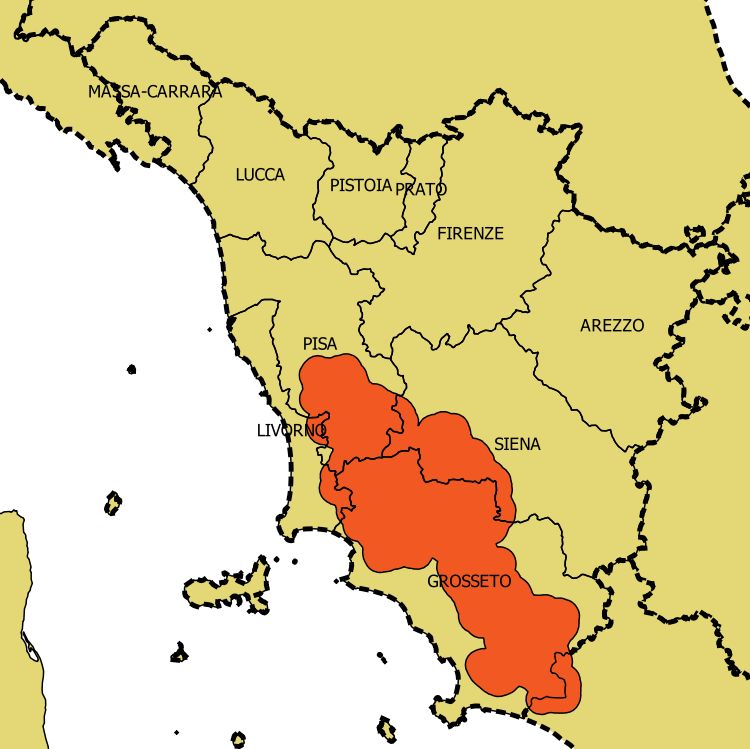
Between June 27 and July 1, 2019, I had the opportunity of attending with the BuioMetria Partecipativa project a part of the fourth “Light Pollution Theory, Modelling, and Measurements” and a workshop connected to the conference. Here you will find a brief summary of the event and the experimental activities related to it, and some highlights (or should I say “high lights”) from the trip from Toscana to Hungary.
Also, please note your next opportunities to interact with BuioMetria Partecipativa and interdisciplinary night promotion and protection: July 16 in Milano, for an outreach event with Wim Schmidt, one of the main Dutch experts on this topic, and from July 25 to 29 in Southern Tuscany, with a visit by prof. Zoltán Kolláth, the mastermind of all the Hungarian events portrayed below, as well as a great progressive rock fan.
Now, back to the LPTMM conference (from June 25 to June 28). This is a bi-annual meeting attracting the main world experts in the field. After the main event, an experimental workshop was scheduled, inviting researchers to conduct night sky quality measurements with different techniques, spanning from the dear, old, Sky Quality Meter (which we called buiometro in Italy), to a plethora of imaging systems complemented by rather sophisticated processing workflows.
Such developments in sensing techniques also reflect the maturity on the light pollution monitoring topic. In the Nineties the focus of the experts was in the mitigation of light pollution effects in relation to night sky observation, as a priority mainly deriving from astronomers in order to reduce the amount of light improperly directed upwards. In the following years, with a greater awareness of the negative effects of the blue component of night lights, and its impact on ecology and landscape, measurement systems have evolved in order to detect such information. Essentially state-of-the-art technology requires the acquisition of “all sky” images, allowing to assess the source direction of lights, as well as spectral data. Combining such information, and integrating it with remote sensing data, as well as drone-derived information, extremely detailed scenarios can be assessed, thus supporting policies and management strategies for lighting systems.
The conference was in the Zselic dark sky park, in the South-West of Hungary. This is one of the three dark-sky areas certified by the International Dark Sky Association, and catered like babies by Zoltán Kolláth: in addition to managing the certification process, in the years the professor has fostered a series of lighting renovation projects in the villages around the “night sky reserves”, developed a structured research, and promotion activities on night sky-related issues.
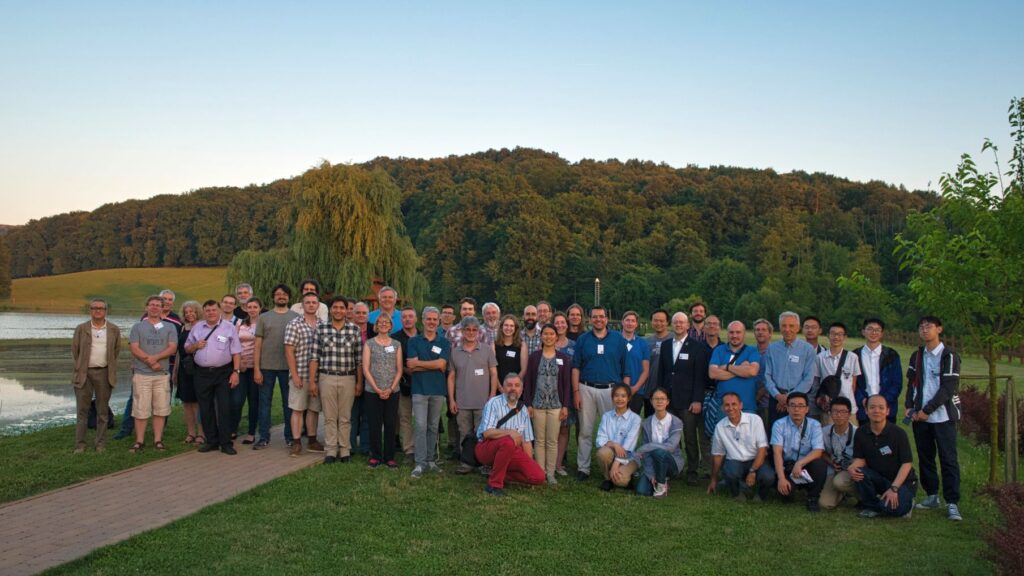
A photo report of the “buiometric” mission and the LPTMM workshop (June 28/July 1 2019)
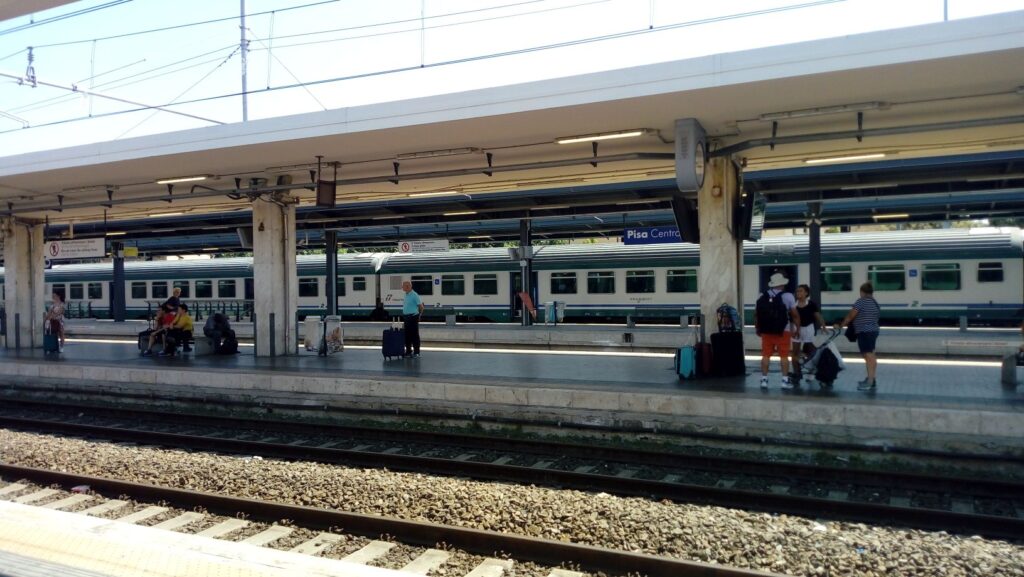
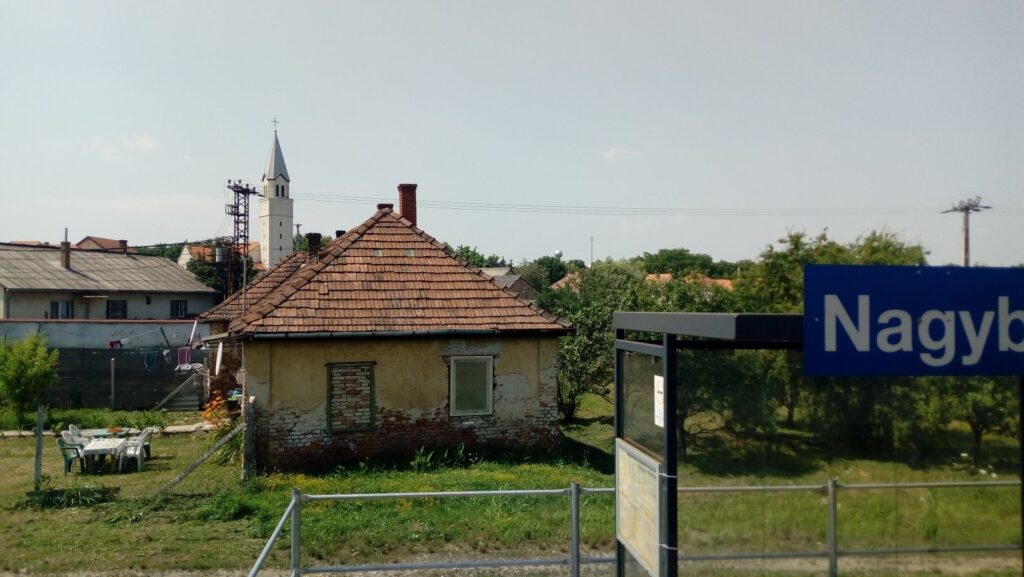
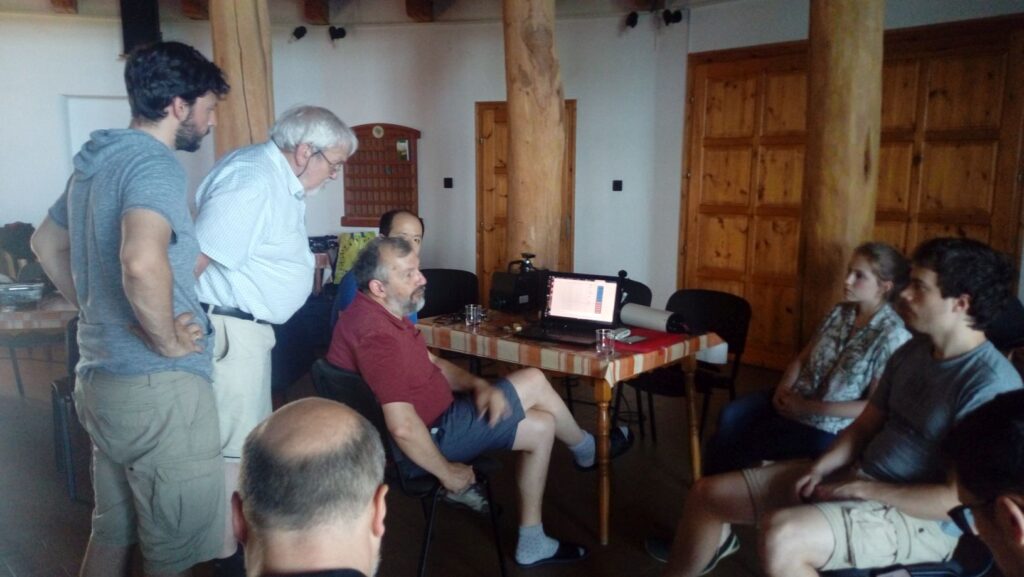
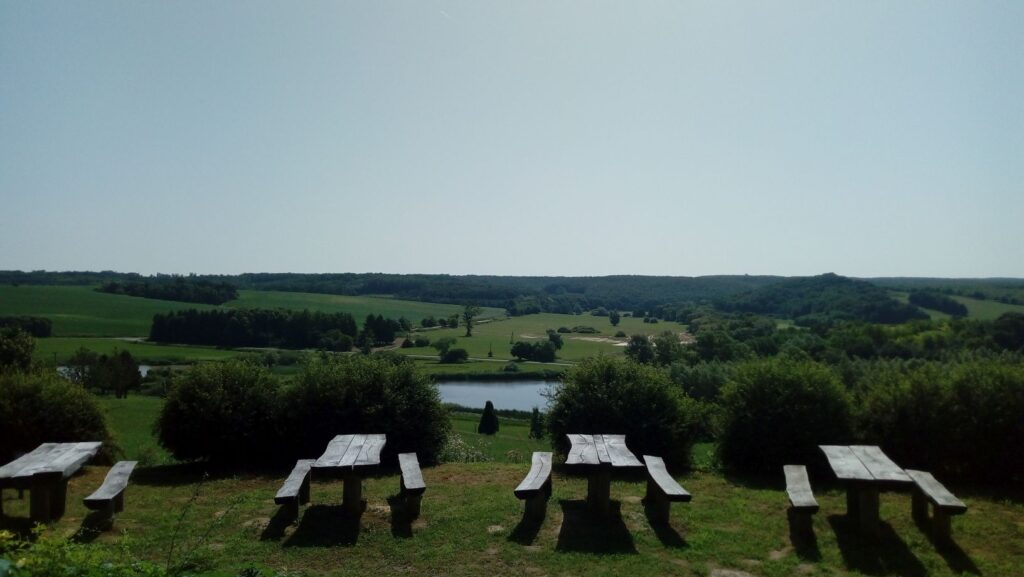
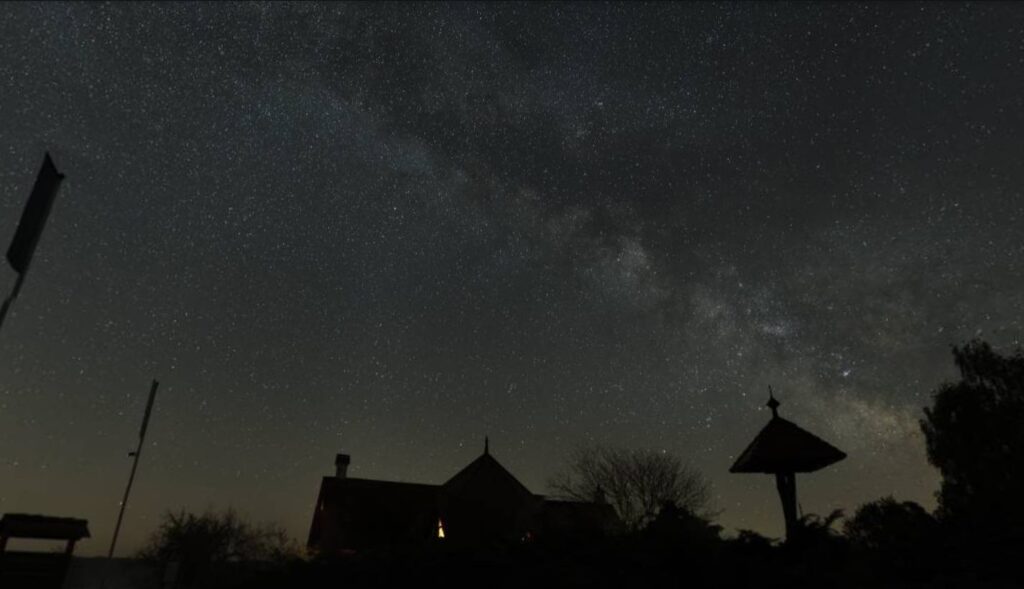
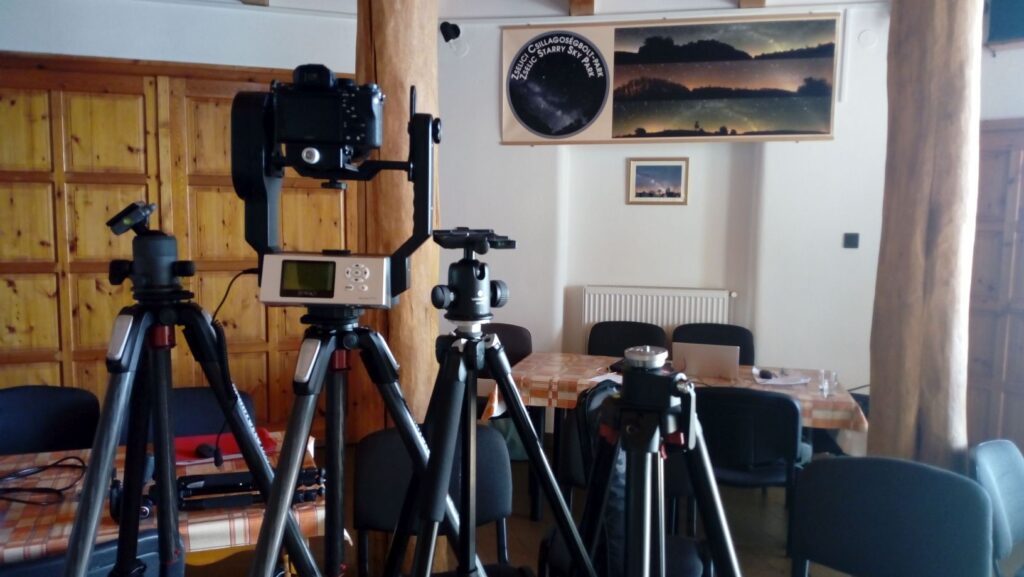
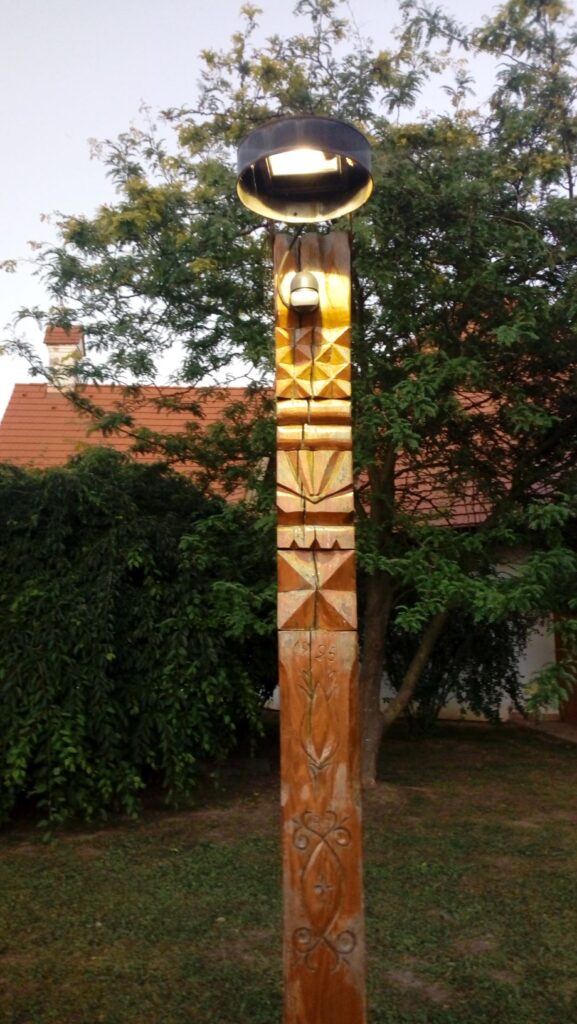
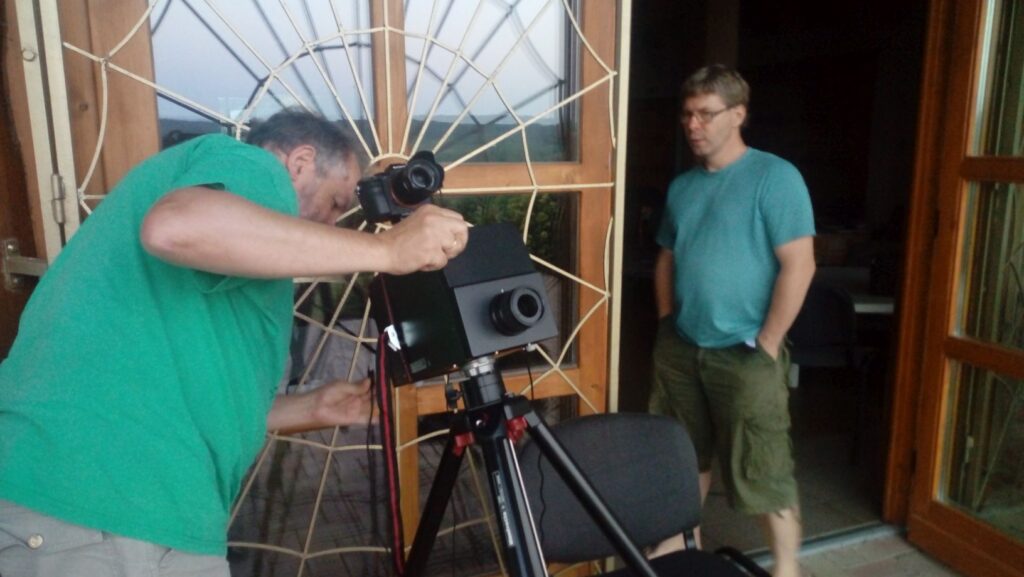
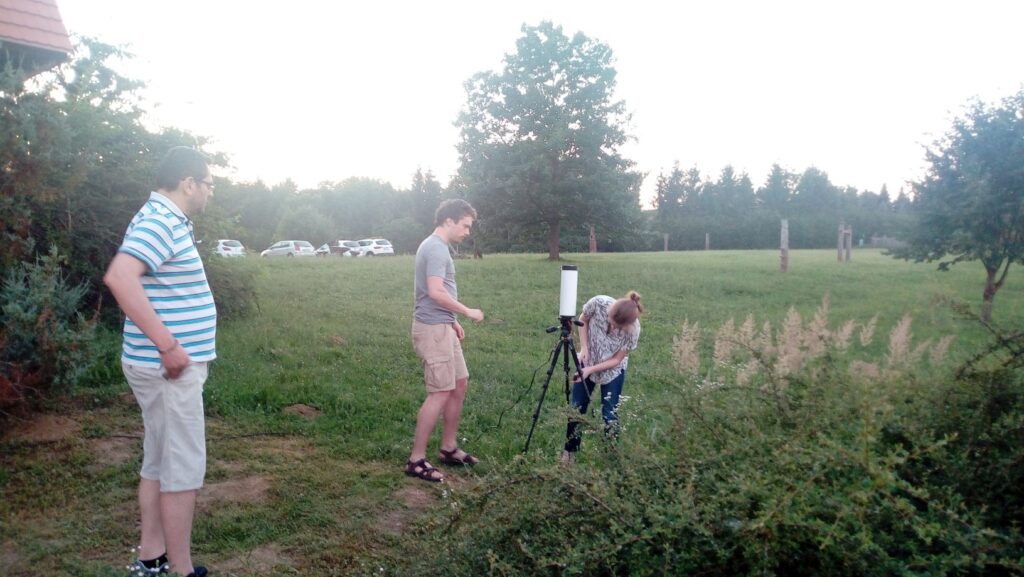
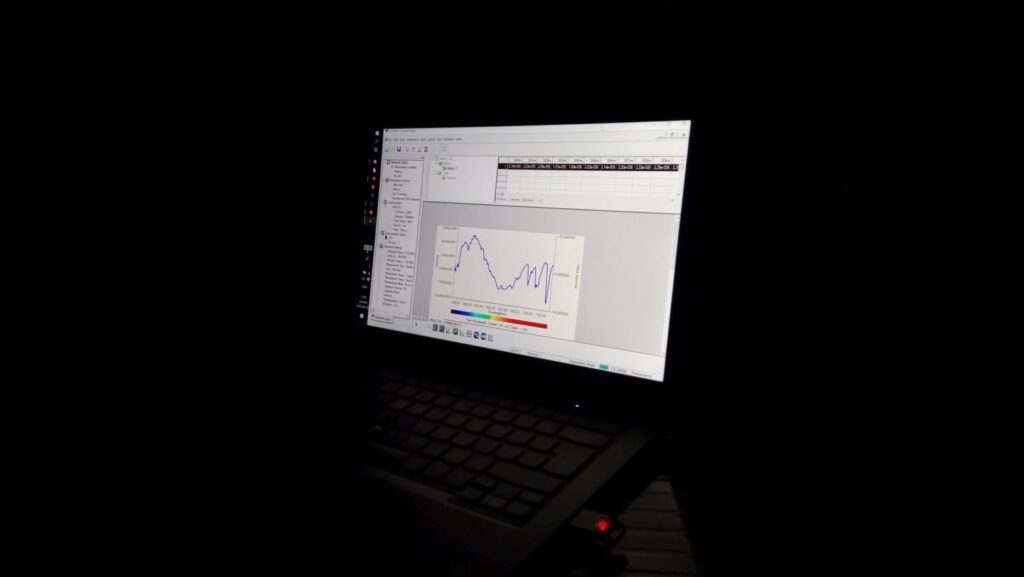
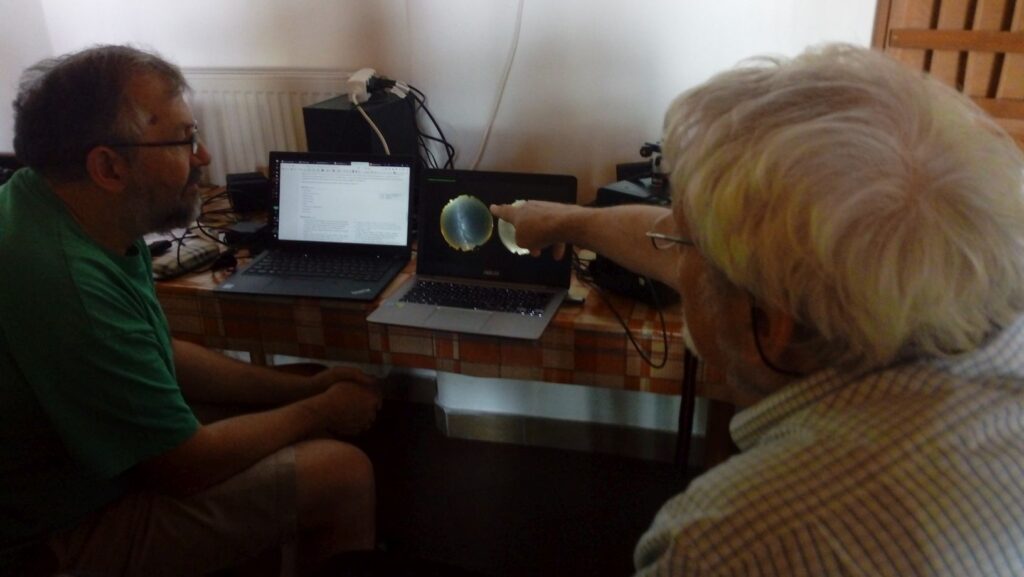
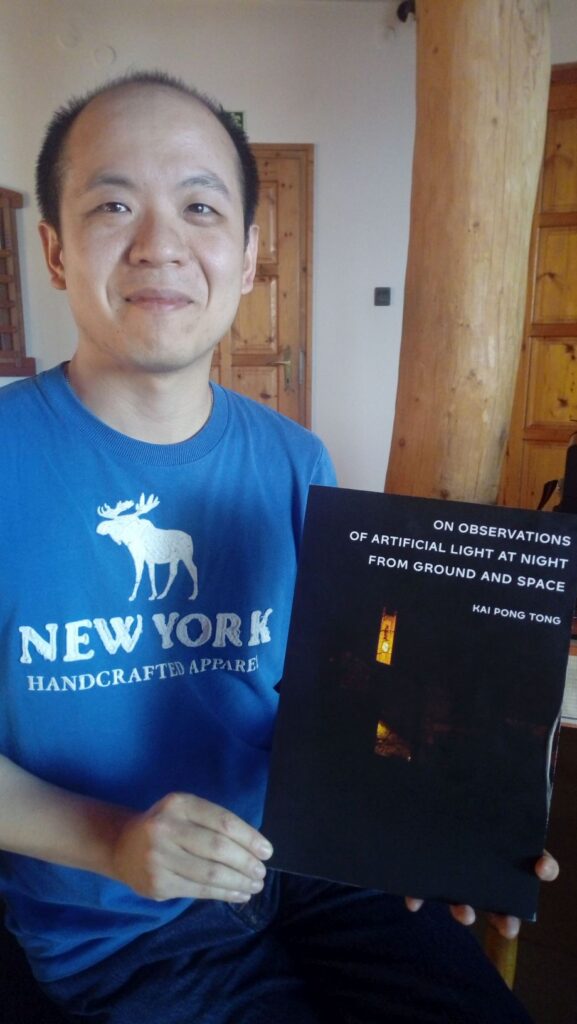
We thank the conference organizers for their hospitality, and grant EFOP- 3.6.2-16- 2017-00014, “Development of international research environment for light pollution studies” for support to this mission. For more information: bmp@pibinko.org
